Here’s what happened to financial markets after Nixon pressured the Fed

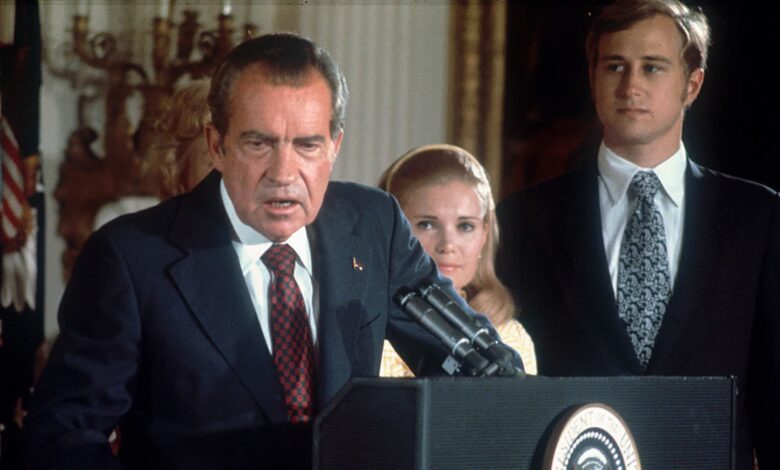
Investors wondering what President Donald Trump’s move to fire Federal Reserve Governor Lisa Cook might mean for financial markets today can look back half a century for some insight. President Richard Nixon, aiming to clinch a second term in the White House, pressured then-Fed Chair Arthur Burns to loosen monetary policy before the 1972 election. Tape recordings of Oval Office discussions show Nixon, who went on to resign in 1974 for abuses tied to the Watergate scandal, used both direct and indirect actions to coerce Burns . More than 50 years later, Nomura currency strategists led by Craig Chan said Trump’s decision to fire Cook, the first African-American woman to sit on the Fed, may “refocus” investors on how the market reacted to Nixon’s attempt to steer the central bank, using the earlier move as a possible guidepost for what to expect now. In the current case, Trump cited unproven allegations of false statements Cook made when applying for a mortgage. Cook said the president “has no authority” to fire her. To be sure, Chan said history “may not be a perfect match” given other variables and how markets have changed since the era of fixed exchange rates, the gold standard and the Bretton Woods post-war monetary system. Still, the Nomura analyst noted historical parallels between Trump’s attempt to fire Cook on Monday and Nixon’s push for less-restrictive monetary policy in the early 1970s. Here’s a look back at how markets fared back in the Nixon years, according to Chan: Currency The ICE U.S. Dollar Index (DXY) , which measures the U.S. greenback against a basket of foreign currencies, saw a massive drop after the U.S. left the gold standard and suffered massive balance of payments deficits under Nixon. The index first rose 0.5% from Nov. 6, 1972 — the day before the election — to a peak in January of the following year, which coincided with a high in stocks. But the dollar index then turned south, tumbling 18% to a July 1973 low. Stocks Similarly, a rise in stocks gave way to an eye-popping slide. The Dow Jones Industrial Average added more than 6% between Nov. 6, 1972 and its peak in mid-January of 1973, right around the time of Nixon’s second inauguration. But within a year of hitting that high, the blue-chip average plunged as much as 19%. Within two years of that Jan. 1973 peak, the 30-stock average at one point plummeted as much as 44%. Treasurys As inflation accelerated, the yield on the U.S. 10-year Treasury note surged. In total, the 10-year yield rose more than 130 basis points between Nov. 6, 1972 and a high on Aug. 7, 1973. At one point, the yield touched a high of 7.58% — more than three percentage points above today’s level around 4.3%. Nomura’s outlook for today The stock market on Tuesday morning appeared to shake off much of the impact of the attempt to fire Cook. So far this year, the stock market has looked past Trump’s pressure on the Fed, despite rising concerns over the central bank losing its independence and the effect that might have on inflation. However, the U.S. dollar took a hit Tuesday with the ICE U.S. Dollar Index down 0.3% vs. a basket of other currencies, bringing its decline for the year to nearly 10%. Gold futures were jumping on concern what a politicized Fed would mean for its inflation-fighting credentials. Chan and team, informed by the Nixon parallel, sees “risks to a weaker USD if the market fears a loss to Fed independence.”


